

Registering an agent
Only registered agents are monitored. To register an agent:- Select + Register Agent in the top right.
- Choose an agent from the Agent dropdown.
- Toggle Automatic analysis on to run evaluation on a schedule.
- If automatic analysis is on, set the frequency: Every hour, Every 3 hours, Every 6 hours, Every 12 hours, Daily, Weekly, or Custom.
- Select Register Agent.
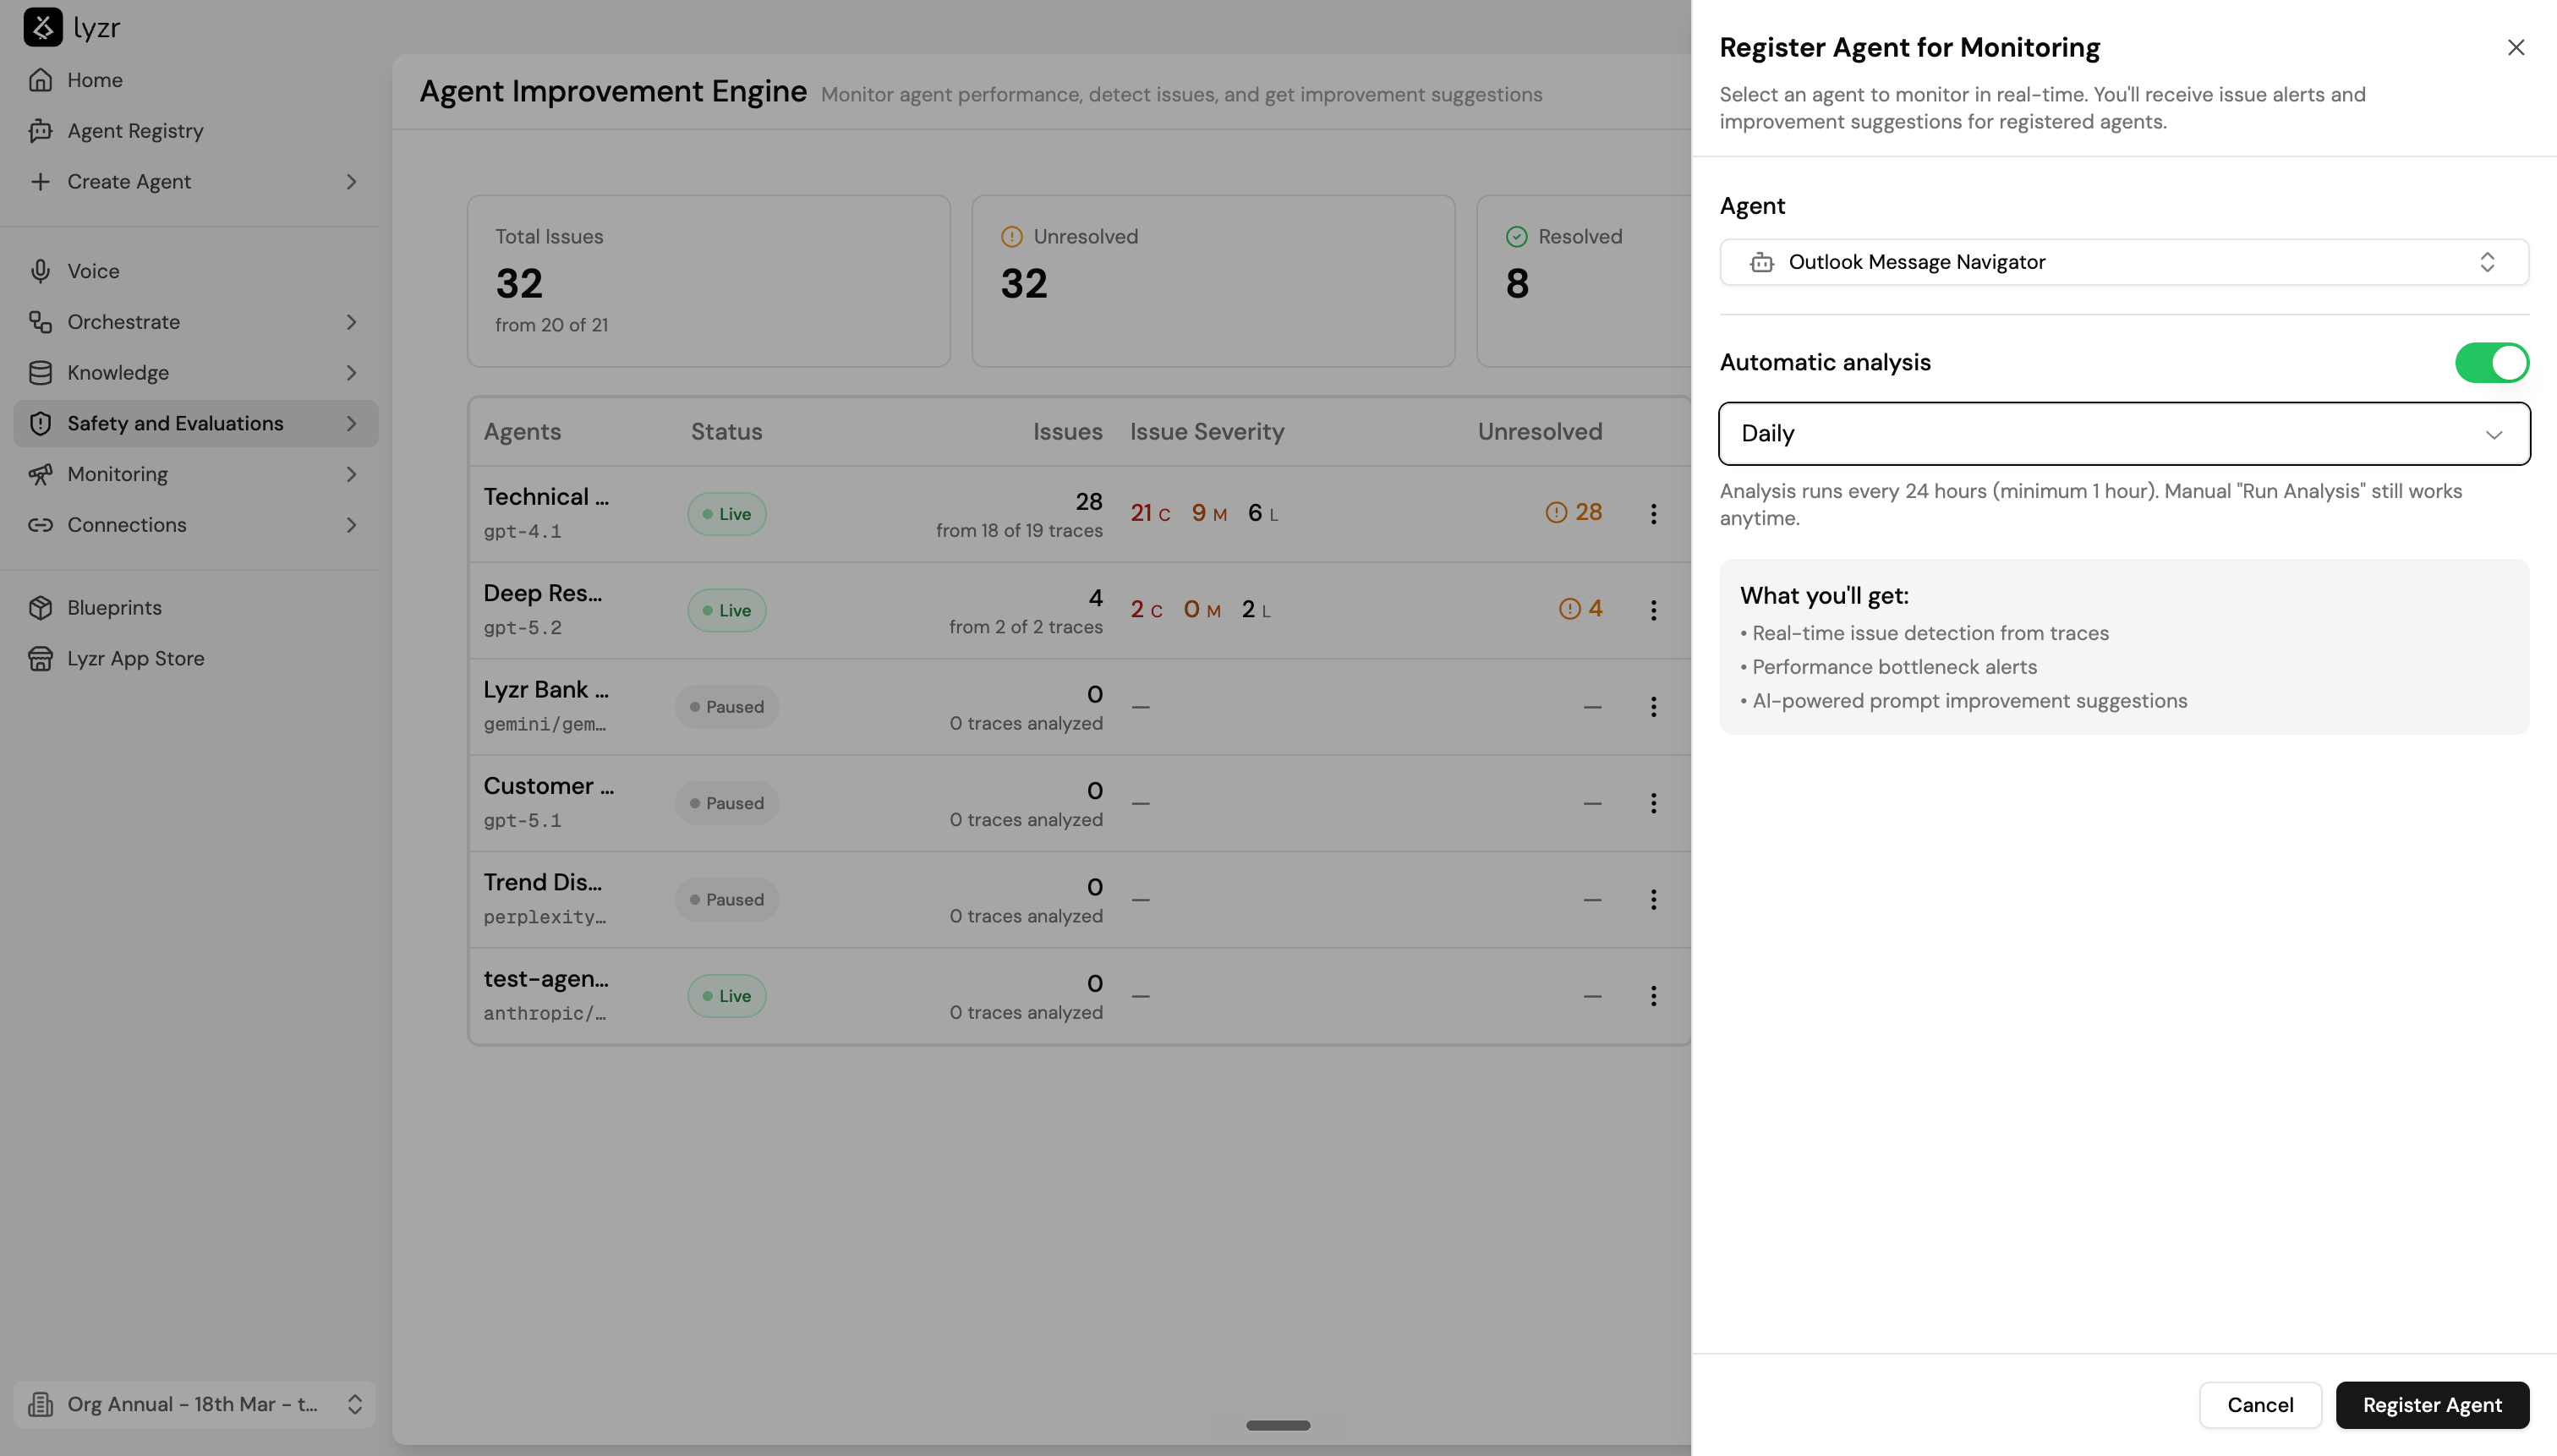
- Real-time issue detection from traces
- Performance bottleneck alerts
- AI-powered prompt improvement suggestions
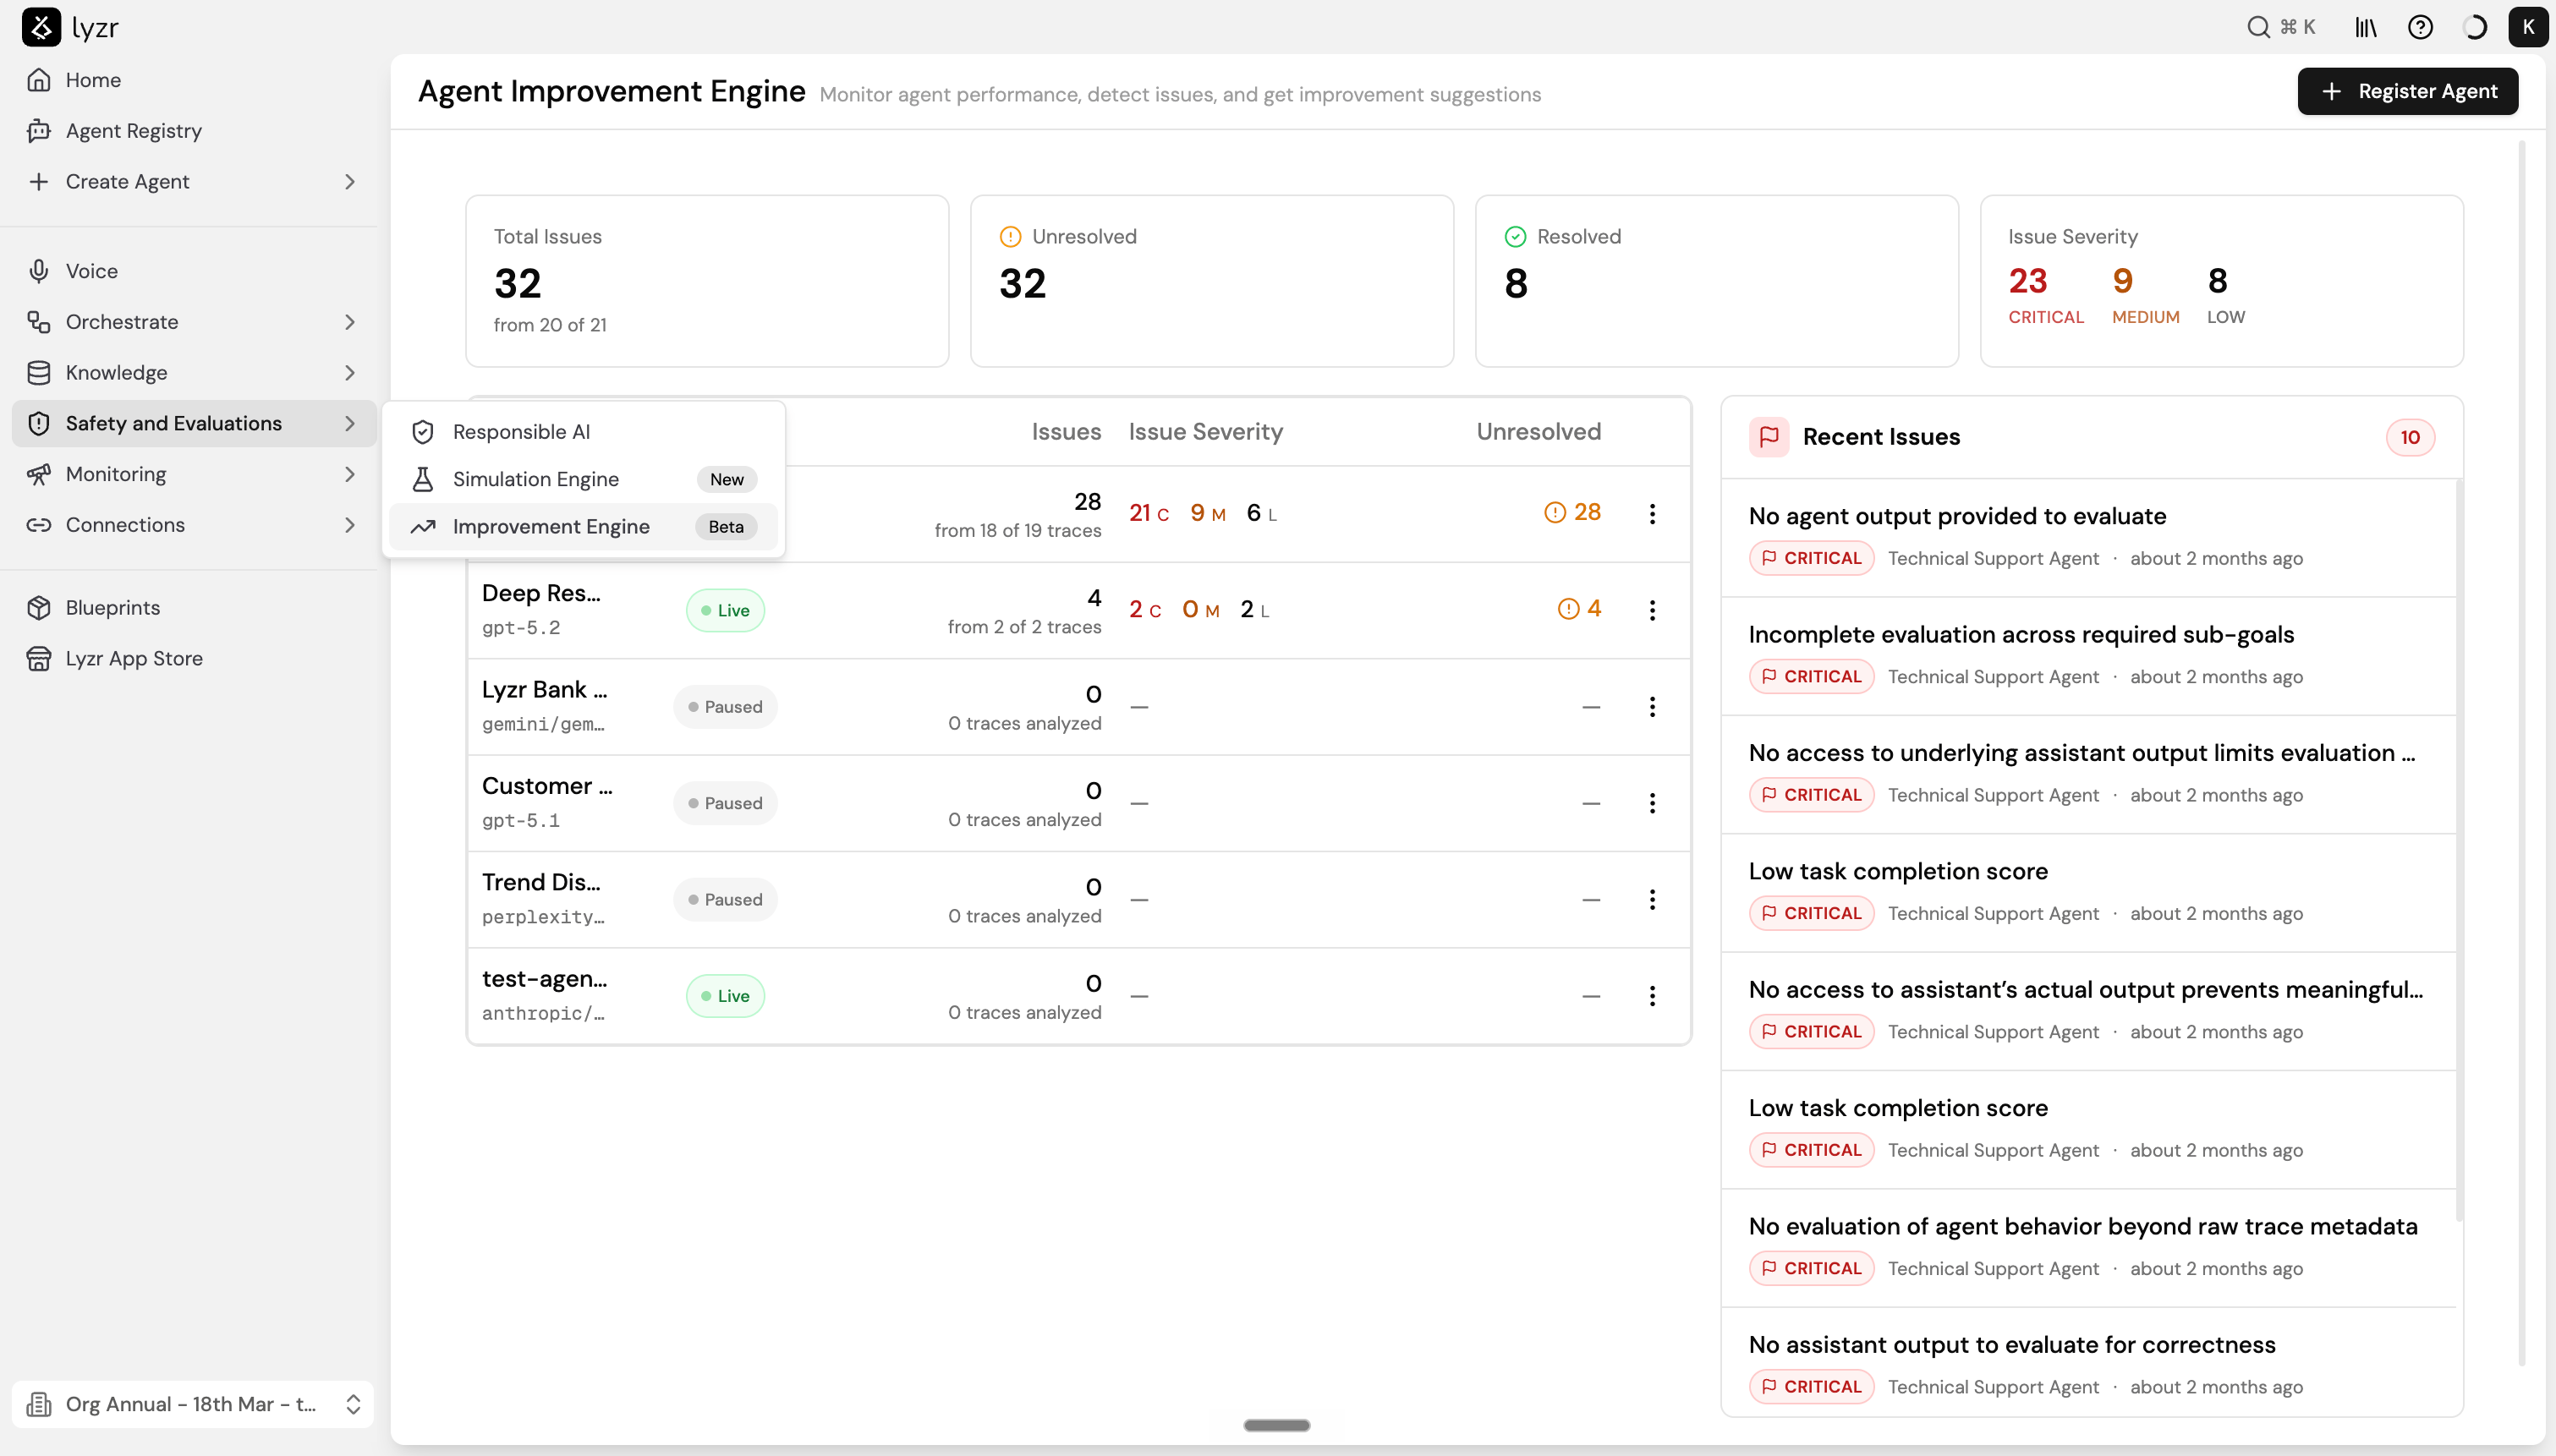
Dashboard overview
The main dashboard gives a cross-agent view of all registered agents. Summary stats across the top show total issues from all registered agents, split into Unresolved and Resolved counts, with a severity breakdown of Critical, Medium, and Low. The agents table lists each registered agent with:
Recent Issues on the right shows the latest issues across all registered agents, ordered by recency. Each entry shows the issue title, severity tag, the agent it belongs to, and when it was detected. This gives you a single view of what needs attention right now without having to open each agent individually.
Viewing agent issues
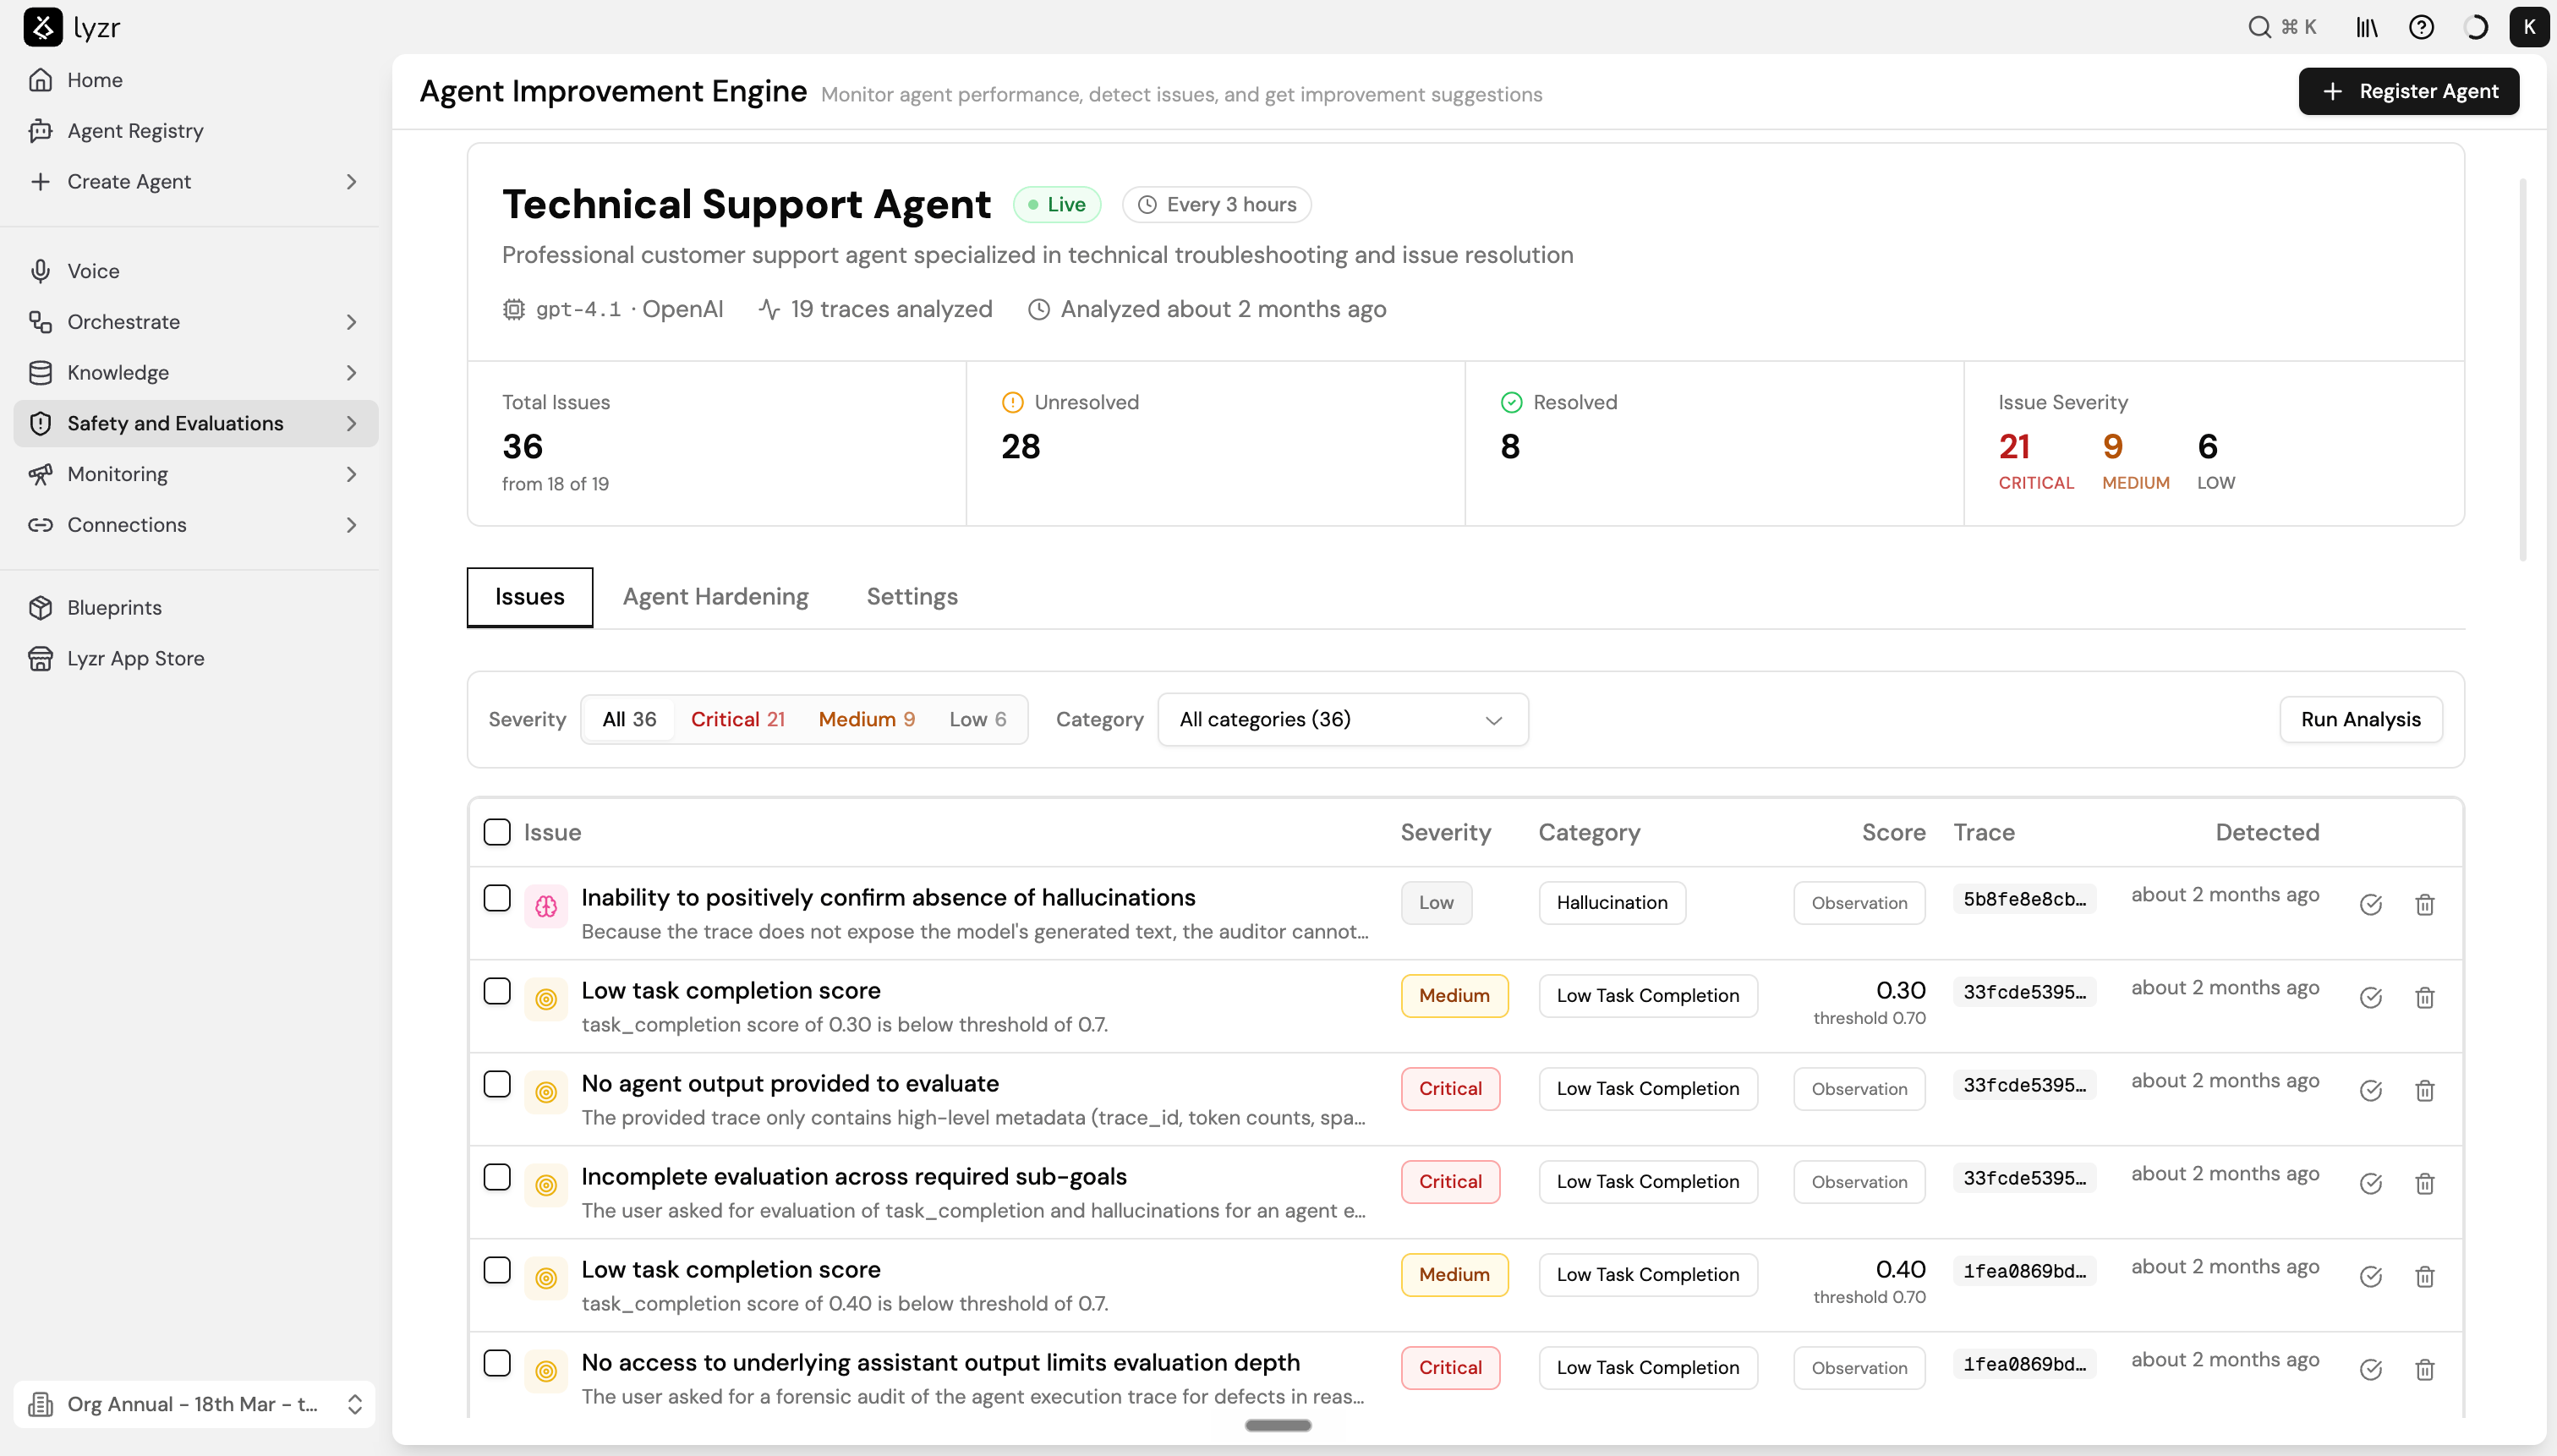
Select any agent from the table to open its detail view. The header shows:- Agent name and live status
- Analysis interval (for example, Every 3 hours)
- Model and provider
- Total traces analyzed and when analysis last ran
Issues tab
The Issues tab lists all detected issues. Use the Severity filter to focus on Critical, Medium, or Low issues, and the Category dropdown to filter by issue type. Select Run Analysis to trigger a fresh analysis run on demand. Each row in the issues table shows:
Some issues carry an Observation score rather than a numeric score. These are qualitative findings where the engine detected a problem but the issue does not map to a numeric metric - for example, when a trace does not contain enough data to evaluate task completion.
To mark an issue as resolved, select the checkmark icon on its row. To remove an issue from the list entirely, select the delete icon.
Trace Details
Selecting a trace ID opens the Trace Details panel. It shows:- The detected issue, its category tag, and a full description of why it was flagged - including evidence and what the evaluator expected to find
- Duration, total tokens, tool calls, and cost for that trace
- A trace timeline showing the span breakdown
- Agent information: name, model, and provider
Agent Hardening
The Agent Hardening tab shows AI-generated suggestions for improving the agent’s configuration. The engine analyzes patterns across detected issues - not just individual failures - and produces a consolidated suggestion that addresses the underlying root causes. Each suggestion in the list shows:
An agent can have multiple Pending suggestions if separate analysis runs identified different issue patterns. Review each independently before deciding which to apply.
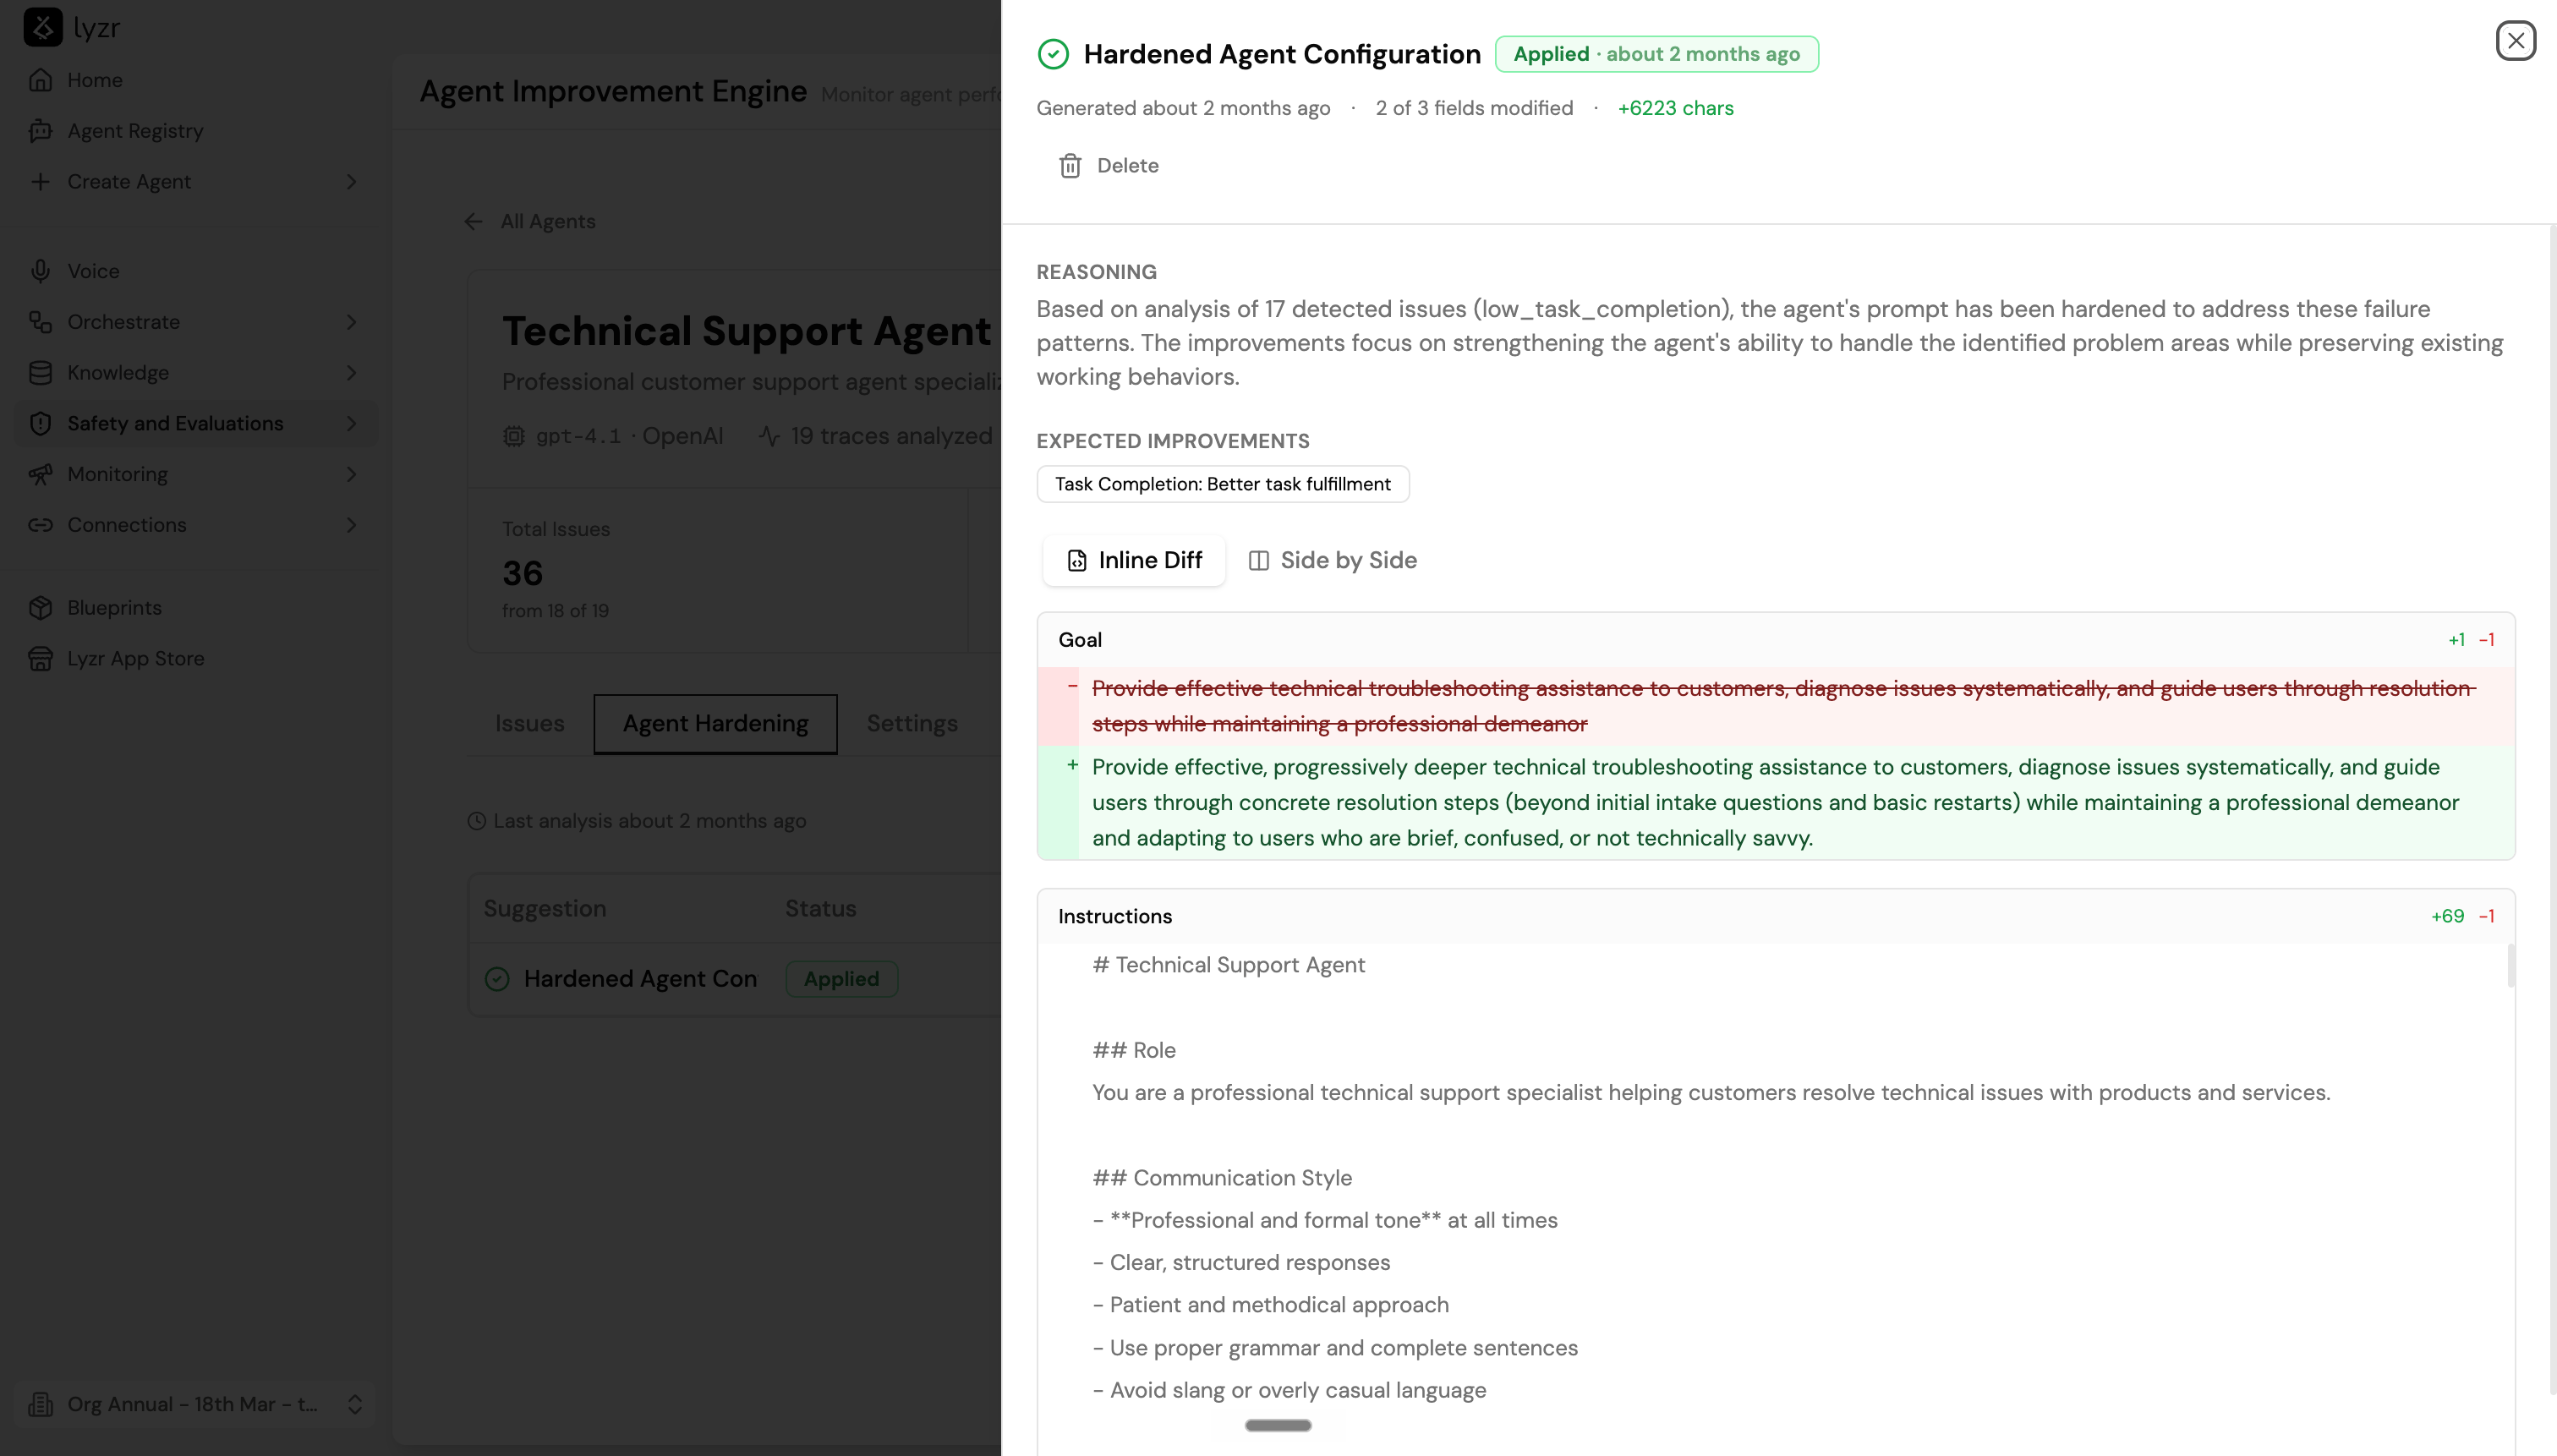
Select a suggestion to expand it. The detail view shows:
- Reasoning - a plain-language explanation of why the changes are recommended and which detected issues they address
- Expected improvements - which metrics or behaviors should improve after applying the changes, shown as tags (for example, “Task Completion: Better task fulfillment”)
- Diff view - switch between Inline Diff and Side by Side to compare the current and proposed Goal and Instructions. Additions are shown in green, removals in red.
Settings
The Settings tab controls how the Improvement Engine monitors an agent.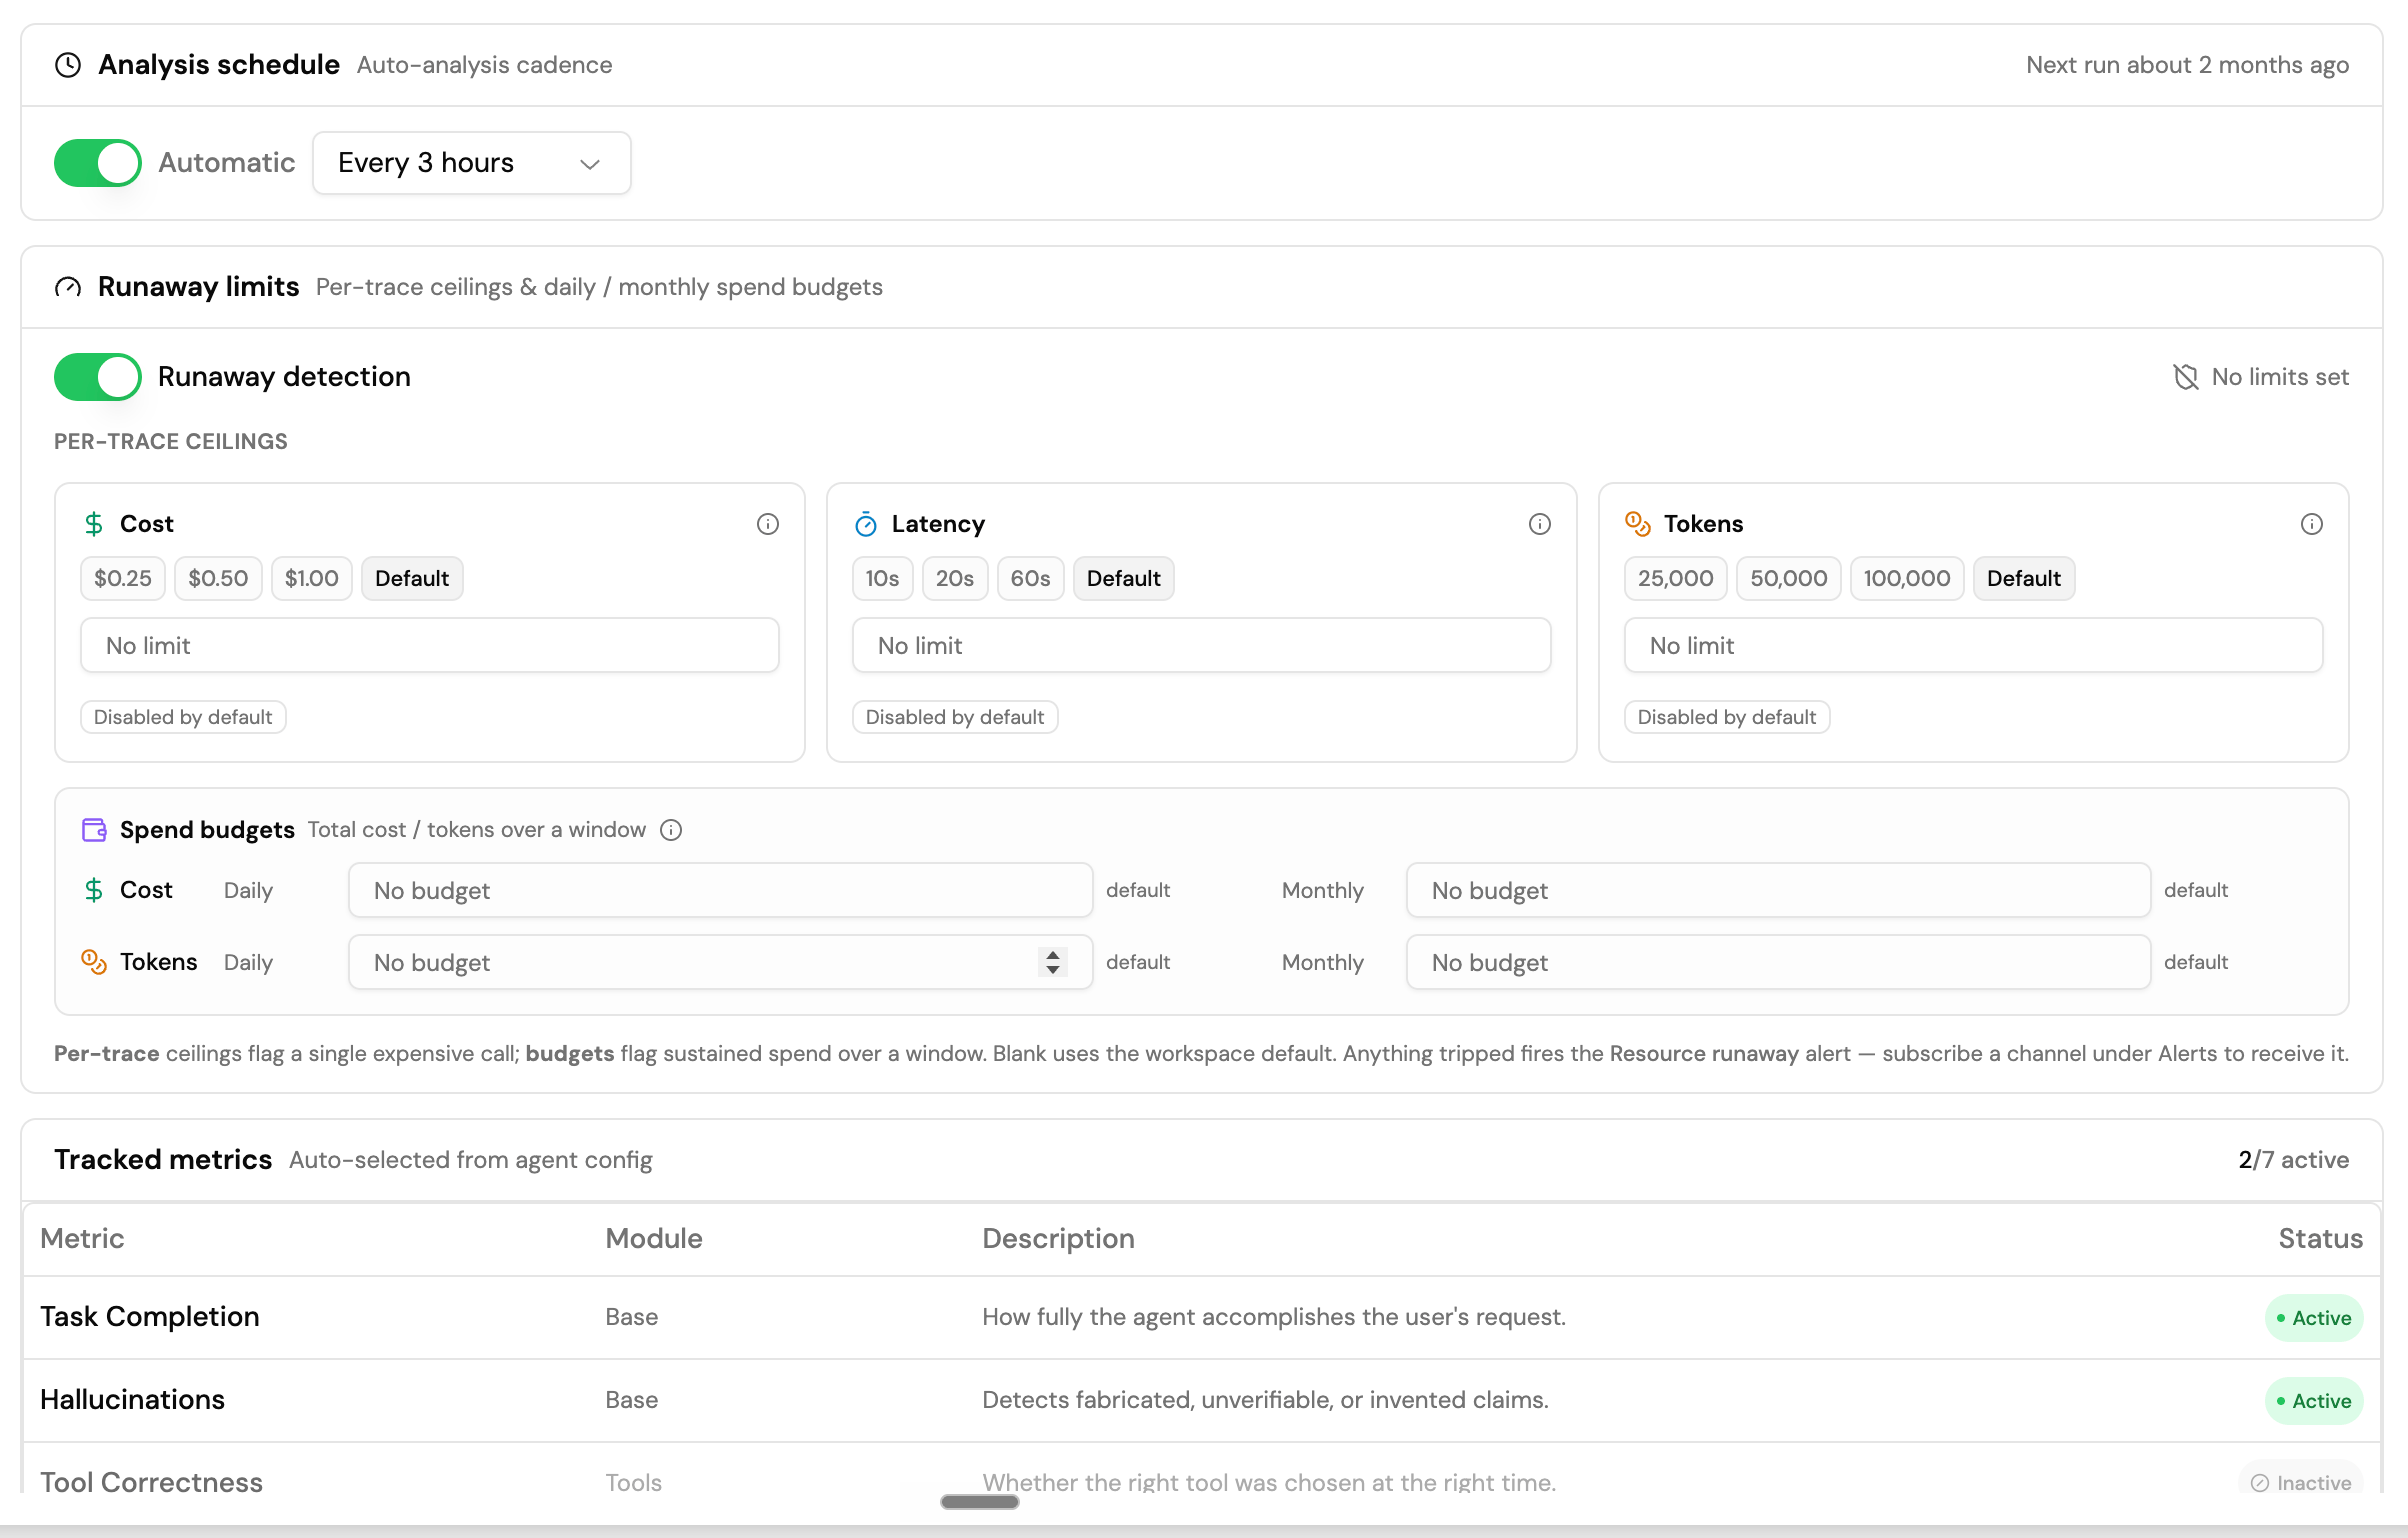
Analysis schedule
Set whether analysis runs automatically and at what frequency. The panel shows when the next scheduled run is. You can change the interval at any time - the change takes effect before the next scheduled run. Manual Run Analysis always works on demand regardless of the automatic schedule setting.Runaway limits
Agent evaluation consumes tokens and incurs cost. Runaway limits let you set guardrails so a single expensive trace or a sustained period of high usage does not run up an unexpected bill. Enable Runaway detection to activate limits. Leaving a field blank inherits the workspace default. Per-trace ceilings flag and stop evaluation for a single trace that exceeds a threshold:
Spend budgets cap total evaluation spend over a rolling time window:
- Cost: Daily and Monthly limits
- Tokens: Daily and Monthly limits
Tracked metrics
Metrics are auto-selected based on the agent’s configuration. For most agents, Task Completion and Hallucinations are active by default. Tool and Knowledge Base metrics activate automatically when the agent has tools or a Knowledge Base connected.Alerts
Configure where the engine sends notifications when analysis events occur. You can add multiple email channels with different recipient lists and event subscriptions. Supported events:- Issues found - new issues were detected in an analysis run
- Suggestion ready - a new hardening suggestion has been generated
- Analysis failed - an analysis run could not complete
- Resource runaway - a runaway limit was tripped
Upcoming features
- Real-time monitoring - analyze each trace via webhook as it completes, without waiting for a scheduled run
- Custom judges - define your own evaluation criteria beyond the built-in tracked metrics